
Group project · real client · 2024
 Decisiones que se ven
A data-visualization system for the Municipality of La Reina: an interactive map table and a tablet app, so a council can see its data while it decides.
- 21students, one group
- 5brigades, run like an agency
- 1real client with real data
- 2presentations to authorities
VIDI was a team effort. On this page the project is told in the first person plural; my own part is written in the first person and marked Mine.
The project
Making a council’s data visible to everyone in the room
VIDI stands for Visualización Interactiva de Datos Integrados: an interface that makes data tangible and visual for the meetings where the municipal council discusses and votes on projects.
The municipality works from the needs of its neighbors, and those needs usually arrive as data. Our research showed that sharing that information and recording what is agreed could be much faster. VIDI is meant to sit in the council room and speed up understanding and discussion.
It is built from two systems that behave as one, plus the documents needed to run it.
-
01
The table
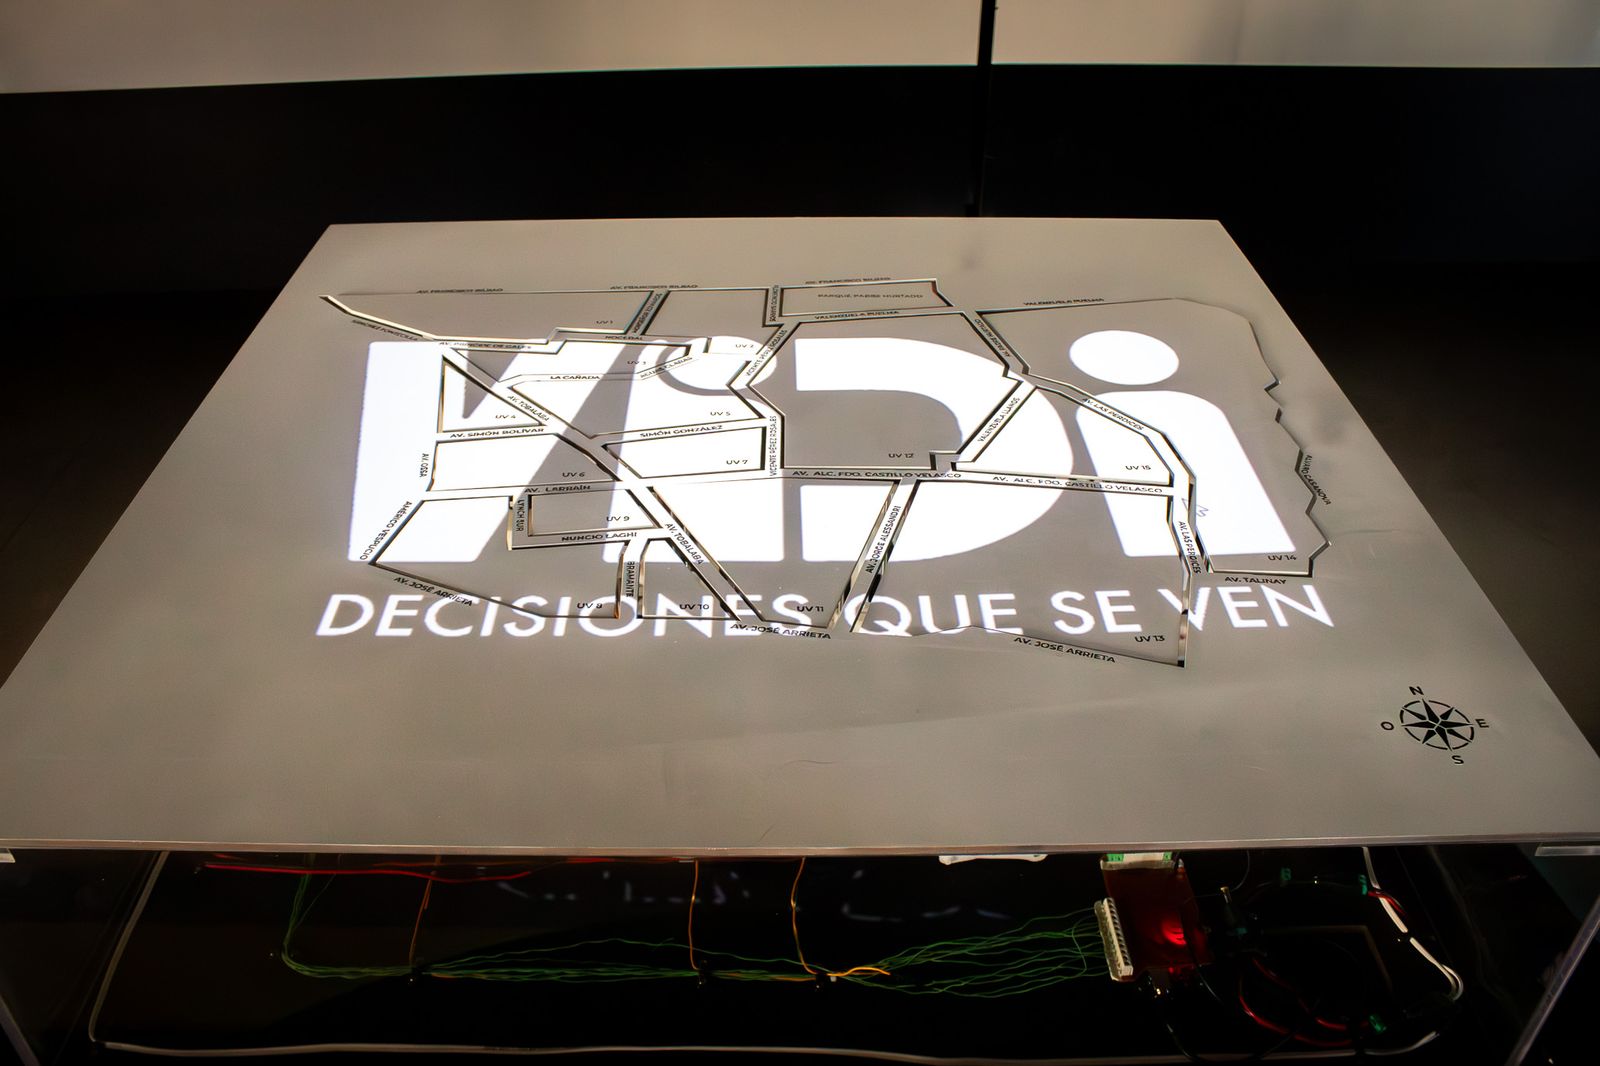
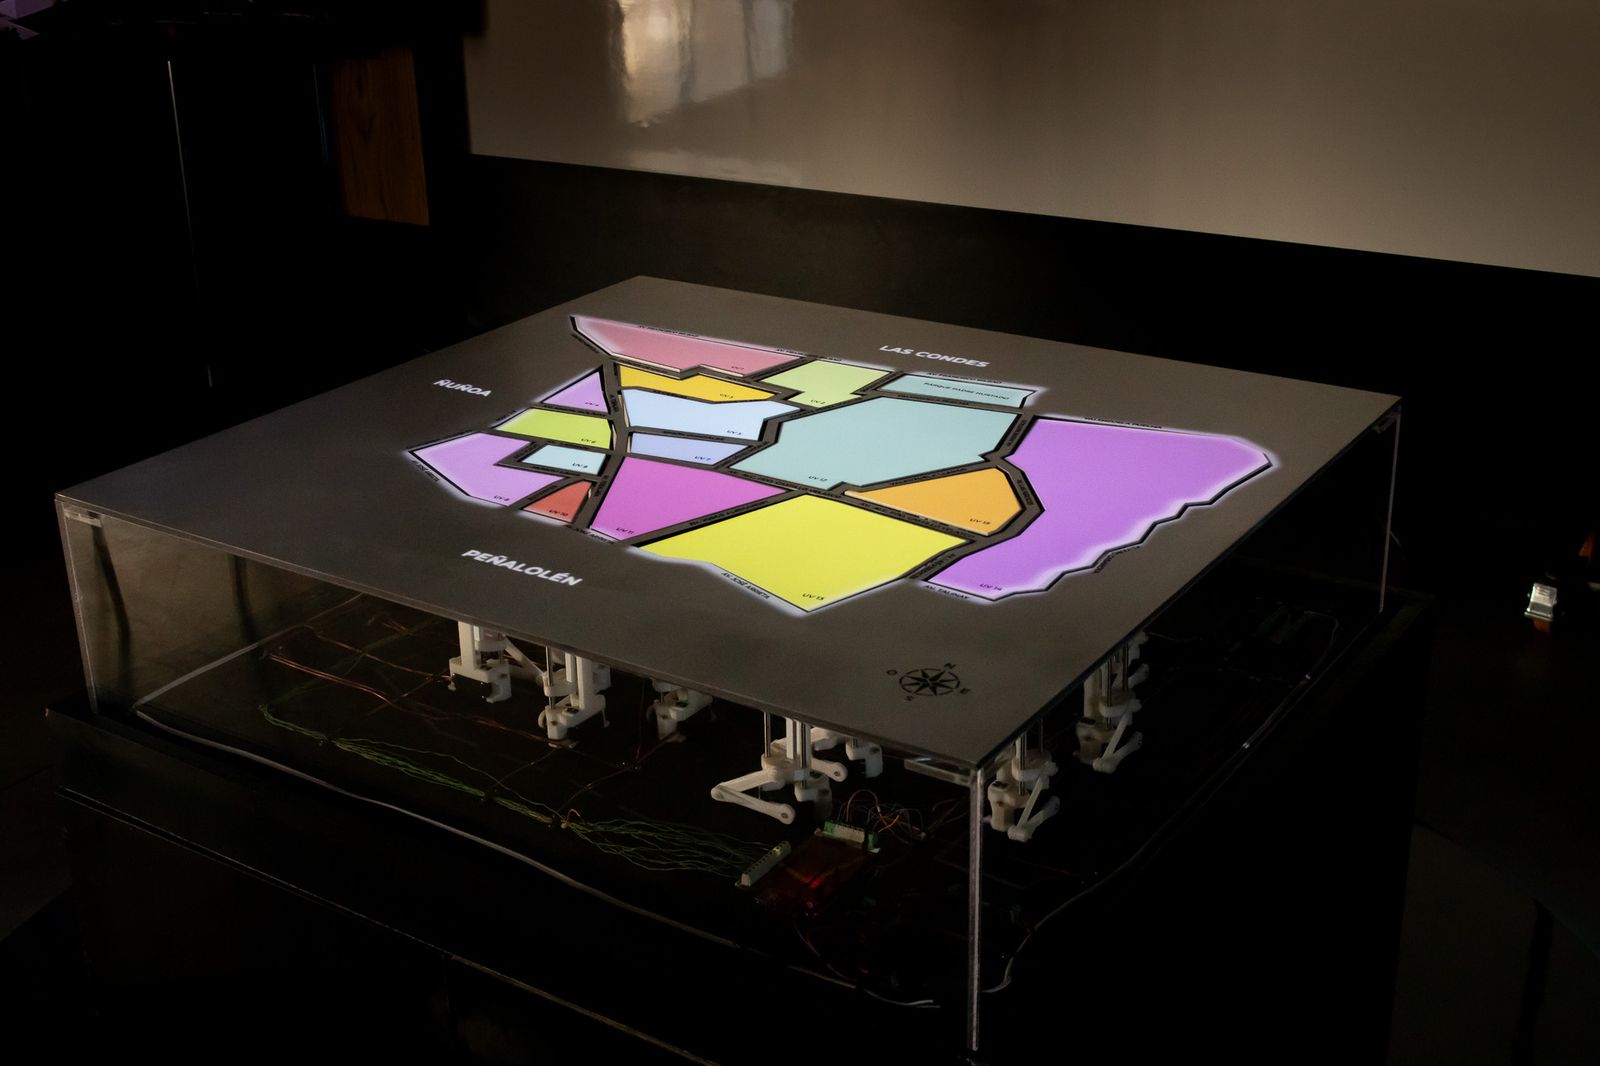
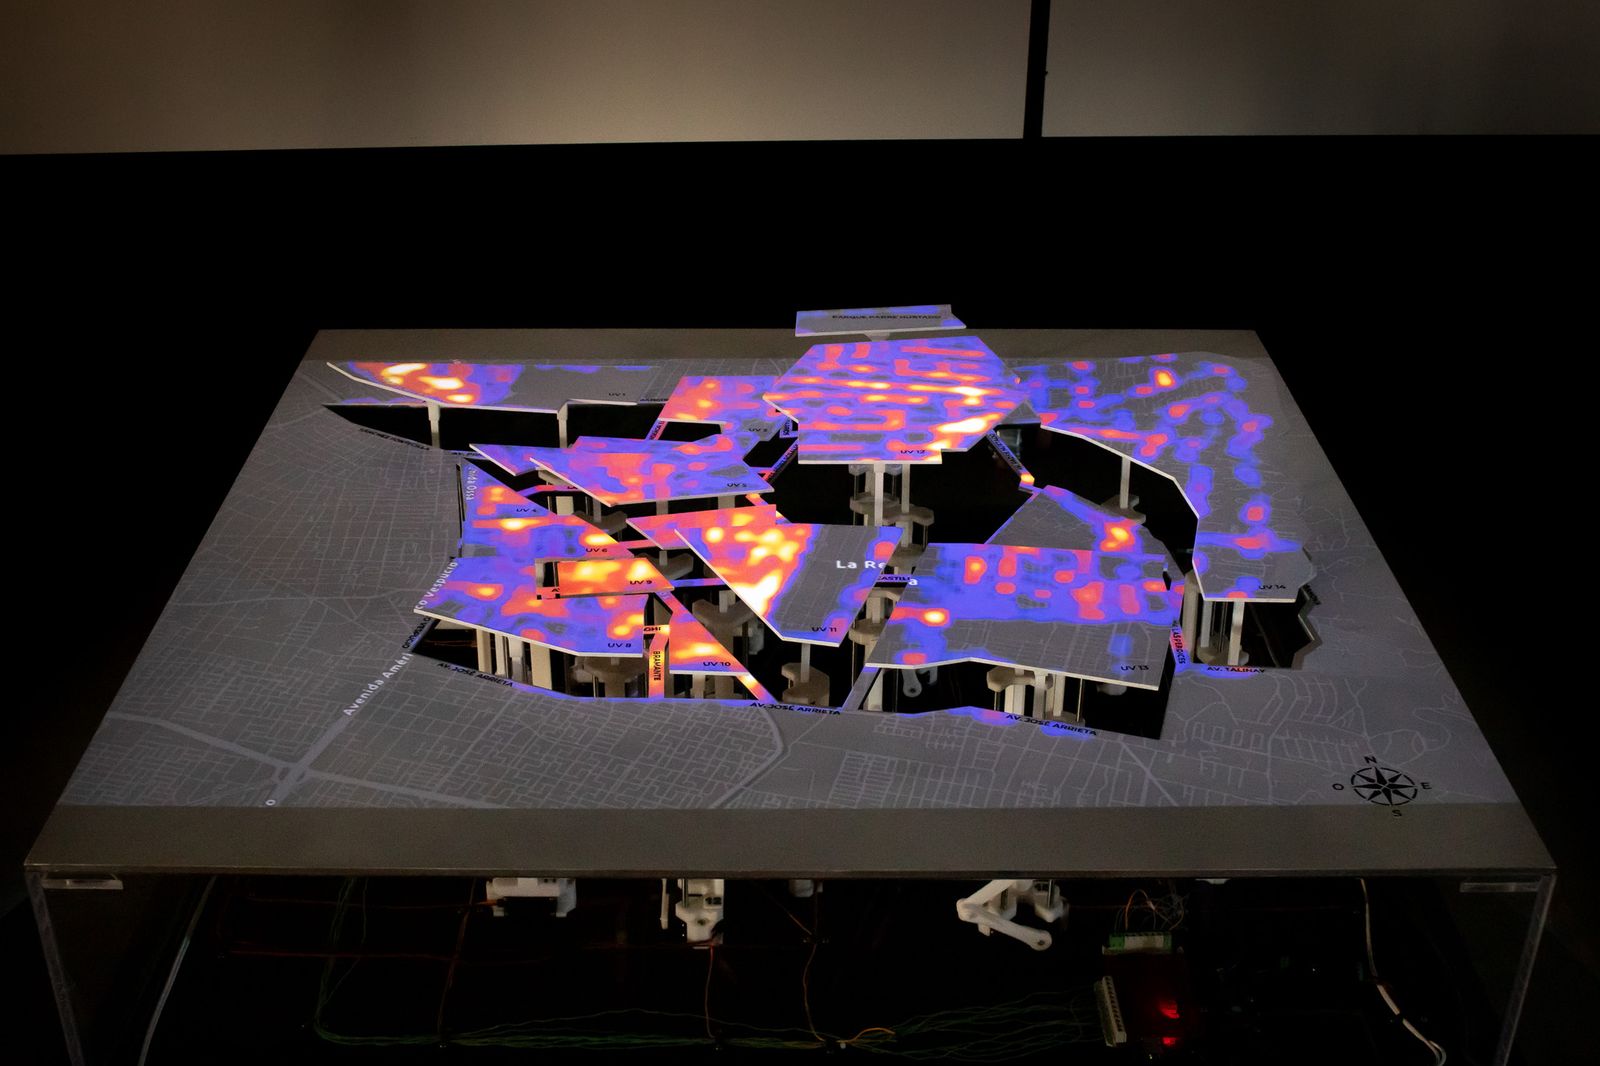
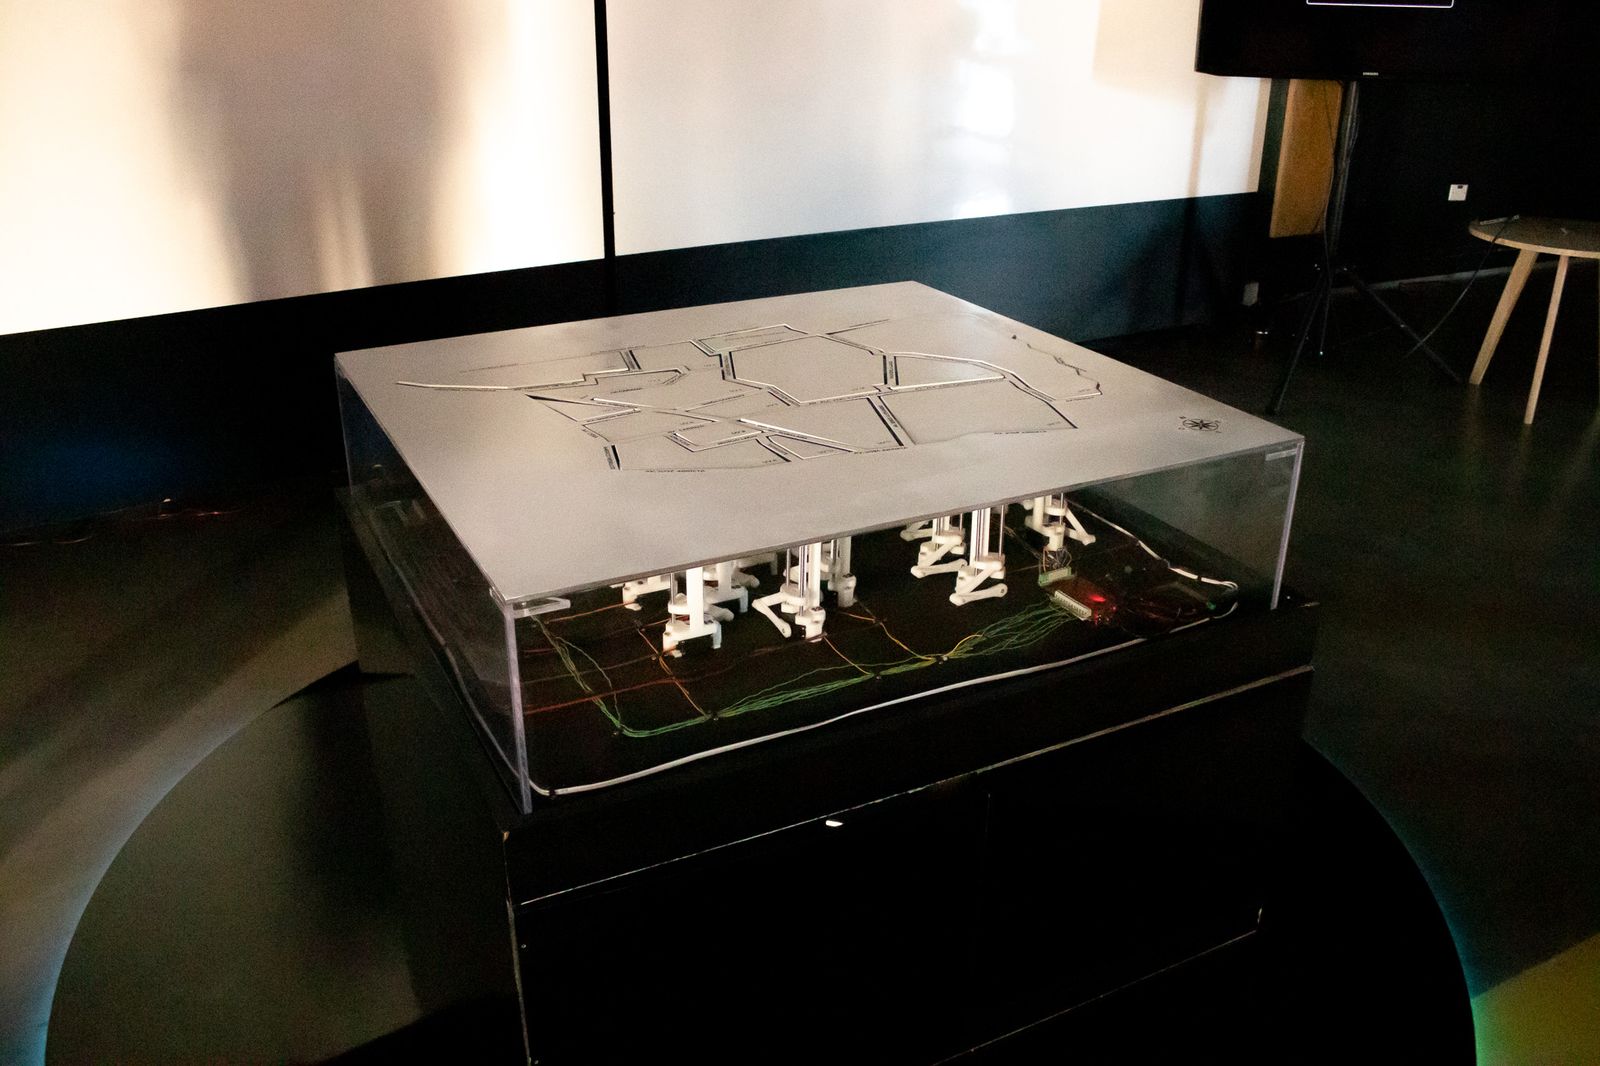
A physical map of La Reina’s neighborhood units whose modules rise, with projections on top, to show the data the council wants to see and to cross it.
-
02
The software
A tablet and computer app that shows what is on the table in real time, so every seat can see it, and that can be sent to a large screen for the whole room.
-
03
The documents
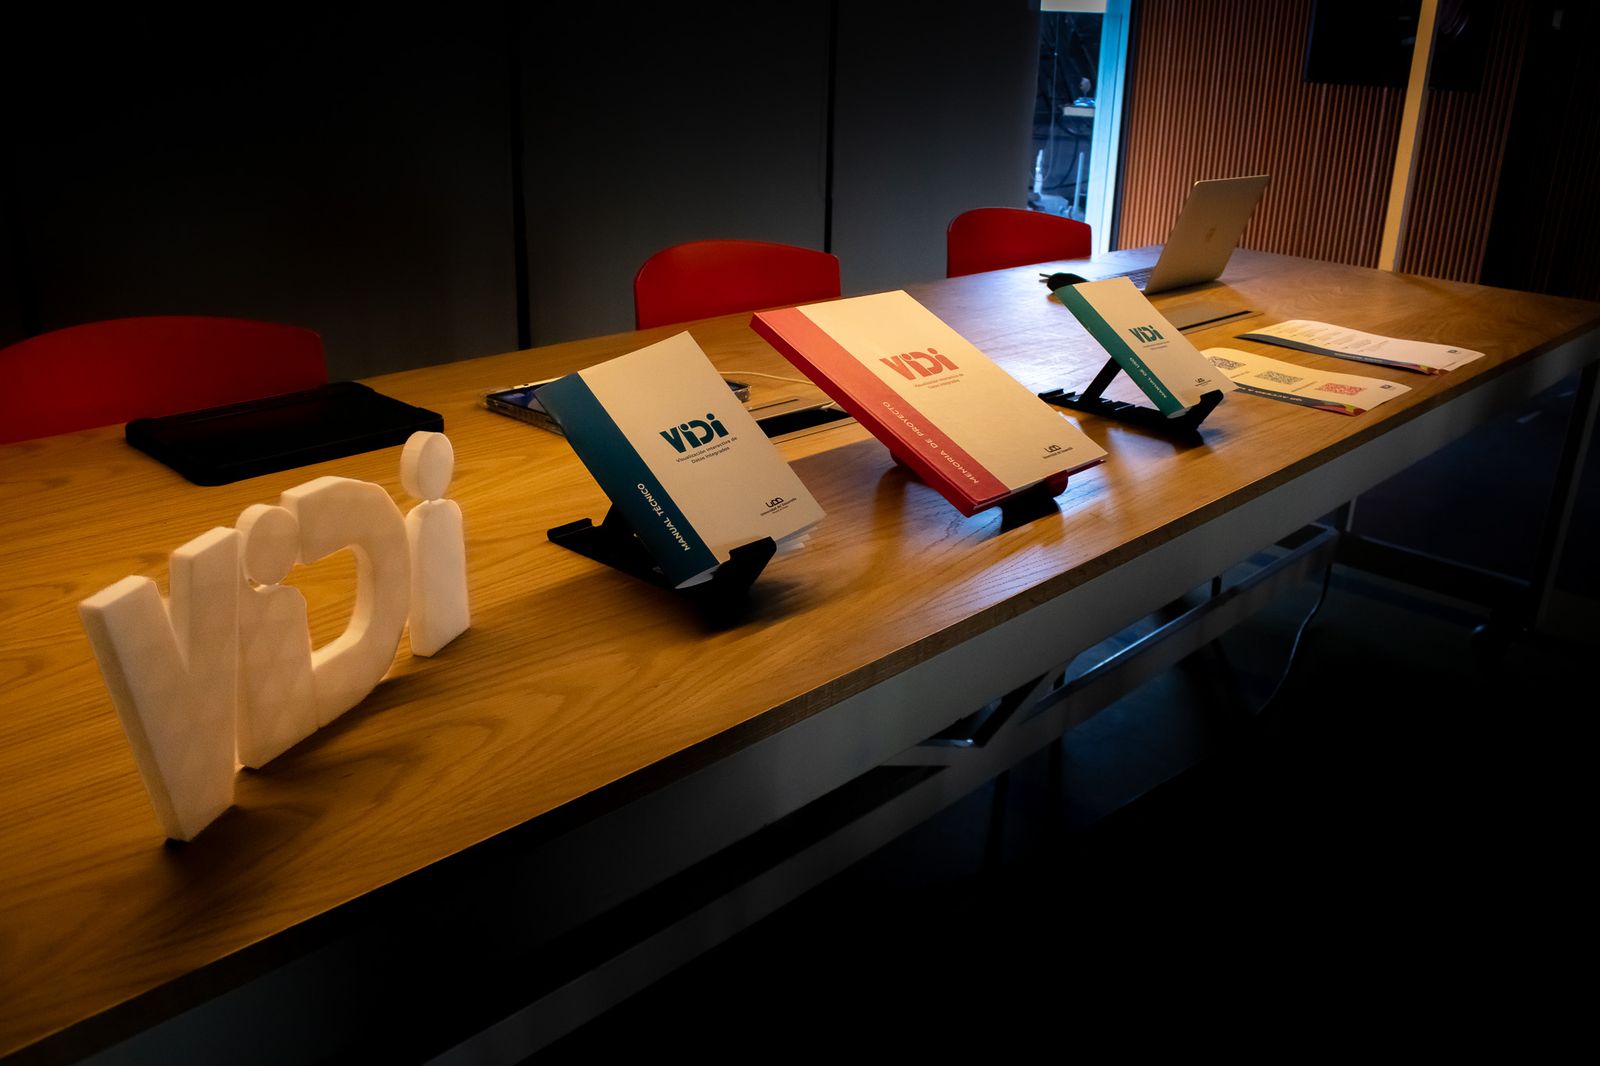
A project memoria, a technical manual and a user manual, so the municipality can run and maintain the system.
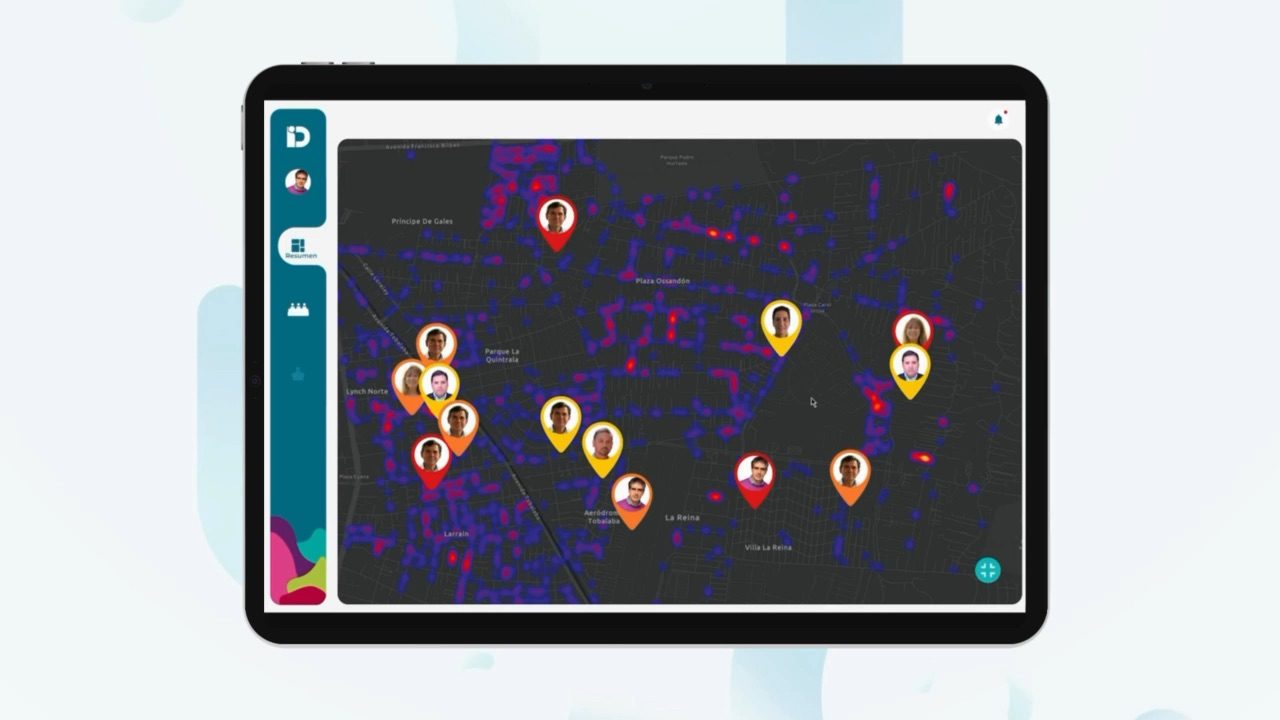
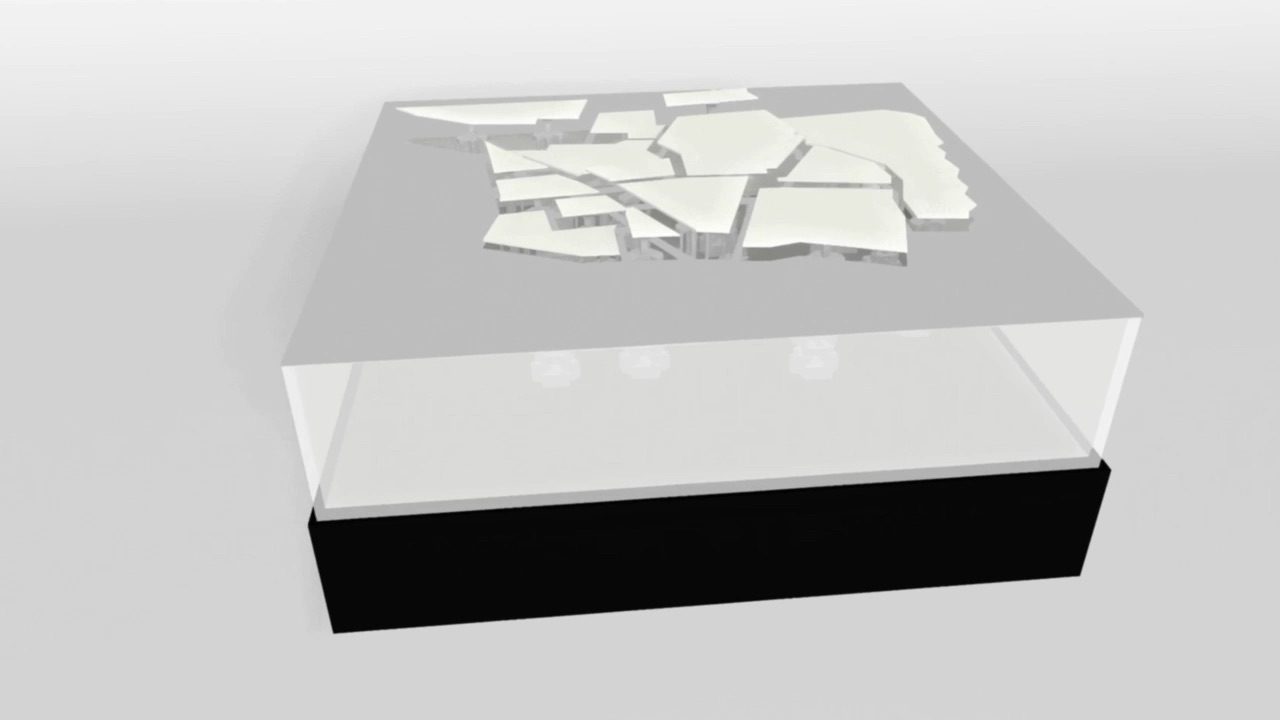
The software, the visual identity and the table were designed and built by the Graphic Interface, Physical Interface and Data brigades — shown here to explain the project, not as my work.
Credit where it is due
VIDI continues FIM
2023 · previous generation
FIM
Fisicalización Interactiva de Mapas
An interactive map table, made in 2023 by the generation of Digital Interaction Design students before ours (ExploraTec UDD). Parts of a physical model rise to represent data, with a projection on top.
We did not make FIM. It was our starting point and our main reference from the beginning.
2024 · our work
What VIDI added
- The table rebuilt on La Reina’s real neighborhood units, drawn from the map the municipality itself uses, instead of the commune’s general outline. We made a new table with a new motor layout, and iterated the mechanism to make it sturdier and easier to maintain.
- A reworked projection and a new data platform. FIM already projected onto the table; we changed it to show the municipality’s own data, prepared in ArcGIS, a platform that, as far as I know, had not been used in FIM before.
- The tablet software, with its own visual identity and design system, that shows and controls the data on the table.
- The documentation: memoria, technical manual and user manual.
How we worked
Five brigades, one project
The workshop split into five areas that worked like an agency, each one responsible for part of the whole.
-
My brigade
Storytelling
The conceptual development, identity and narrative of the project. We unified the stories of all the brigades into one coherent speech.
-
Data
Collected and cleaned the municipality’s data and looked for correlations to project on the table.
-
Graphic Interface
Designed the visual identity, the design system and the software prototype.
-
Physical Interface
Rebuilt the table, its mechanisms, motors and code.
-
Records & Memoria
Documented every stage and produced the memoria and both manuals.
Key moments Mine
Some of the moments that shaped my part
VIDI took a whole semester of classes, group meetings (some at classmates’ homes) and work sessions, and I took part in many of them. These are the most important moments I took part in, not a complete list. None of them was done alone: it was always a conversation with the rest of the workshop.
-
9 April & 6 June 2024
Research: understanding the users
On 9 April I attended a session of the municipal council to see how it actually works: who speaks, what they show, how decisions are recorded. On 6 June I met with the municipality’s head of security.
What the group learned from these visits shaped the project. For example, there was no digital channel to record what was discussed and agreed; every official used a different map, and could not share it; and presentations often had to be complemented with printed maps.
What I saw in those meetings stays between us and the municipality. Here I only share what the project’s public memoria already says.
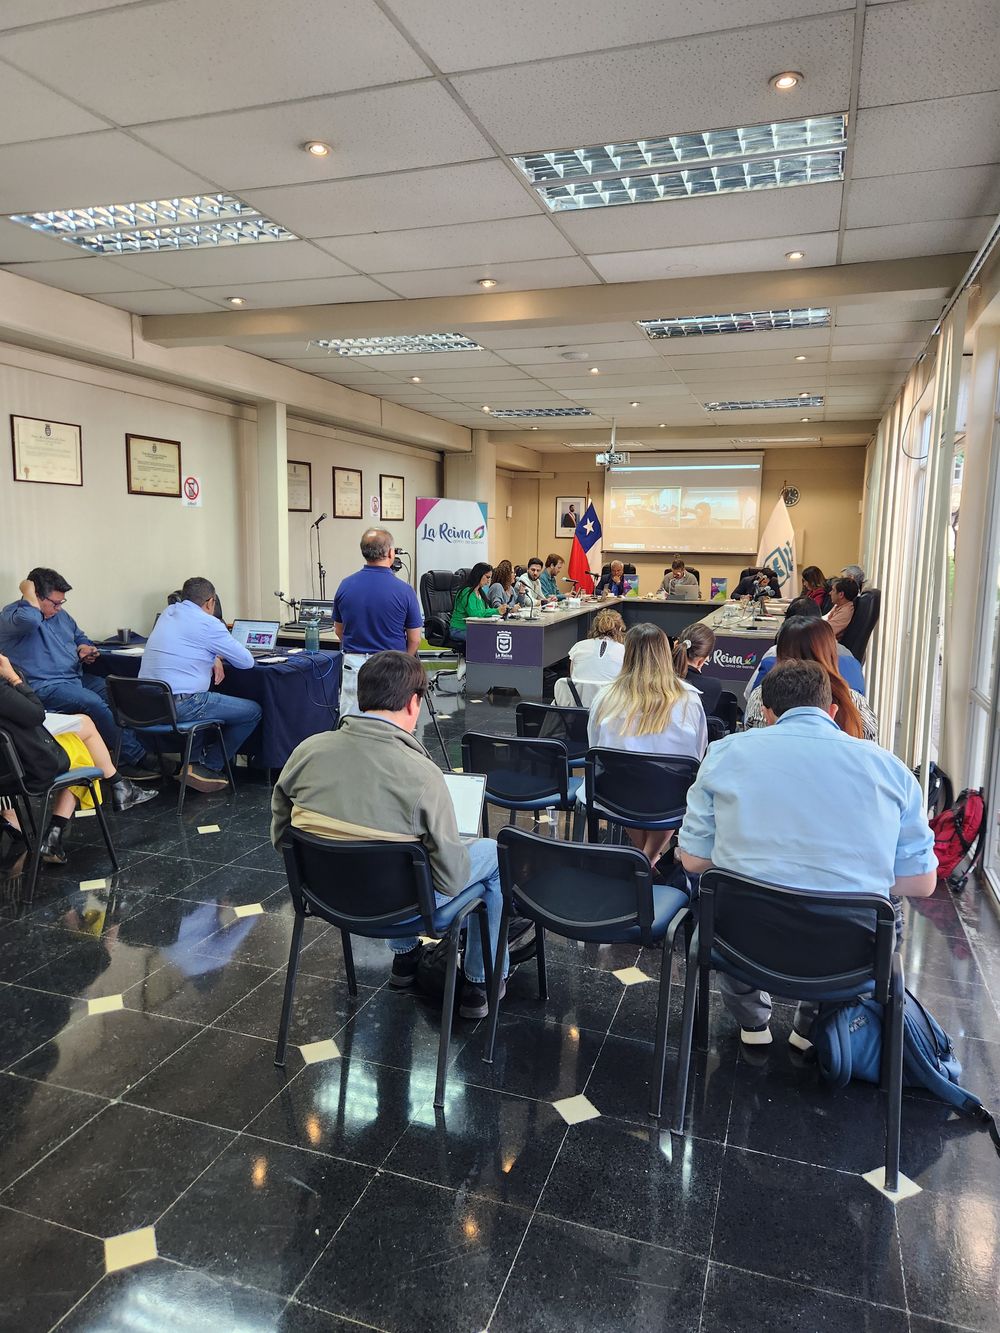
Council session, 9 April. The session, from where we sat. -
April 2024
Brainstorming & information architecture
With the whole workshop, we put ideas on the whiteboard, grouped them, and built the structure of the software together: which screens exist, what each one is for, how you move between them. Everyone contributed and we built on each other’s ideas.
These sessions fed the structure of the app, which ended up with a summary mode, a collaborative map and a meeting mode for the council.
Brainstorming and information architecture with the whole workshop. 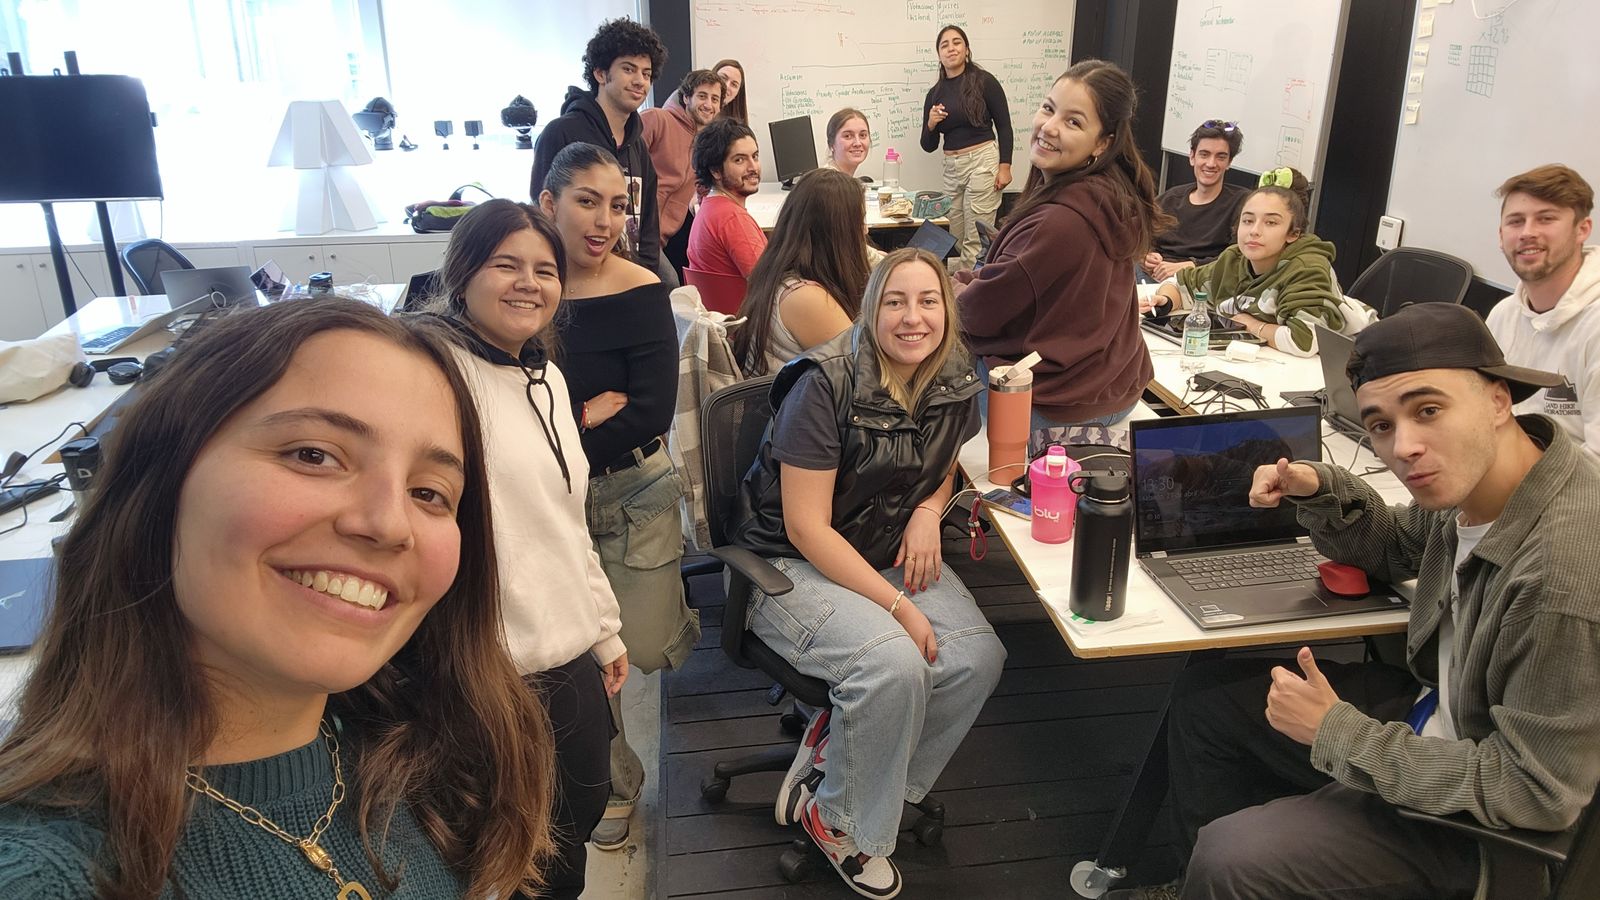
Working sessions in class, April. -
May & July 2024
The narrative
As Storytelling, our job was to make five brigades sound like one project. We wrote the line “Decisiones que se ven” (decisions you can see) and built the story the municipality and the university heard twice.
In both presentations I opened the project: the theoretical framework, the welcome and the value proposition. The name VIDI was chosen by all 21 of us; the logo was designed by the Graphic Interface brigade.
- Innovation
- Usability & intuition
- Friendly
- Attractive
- Collaborative environment
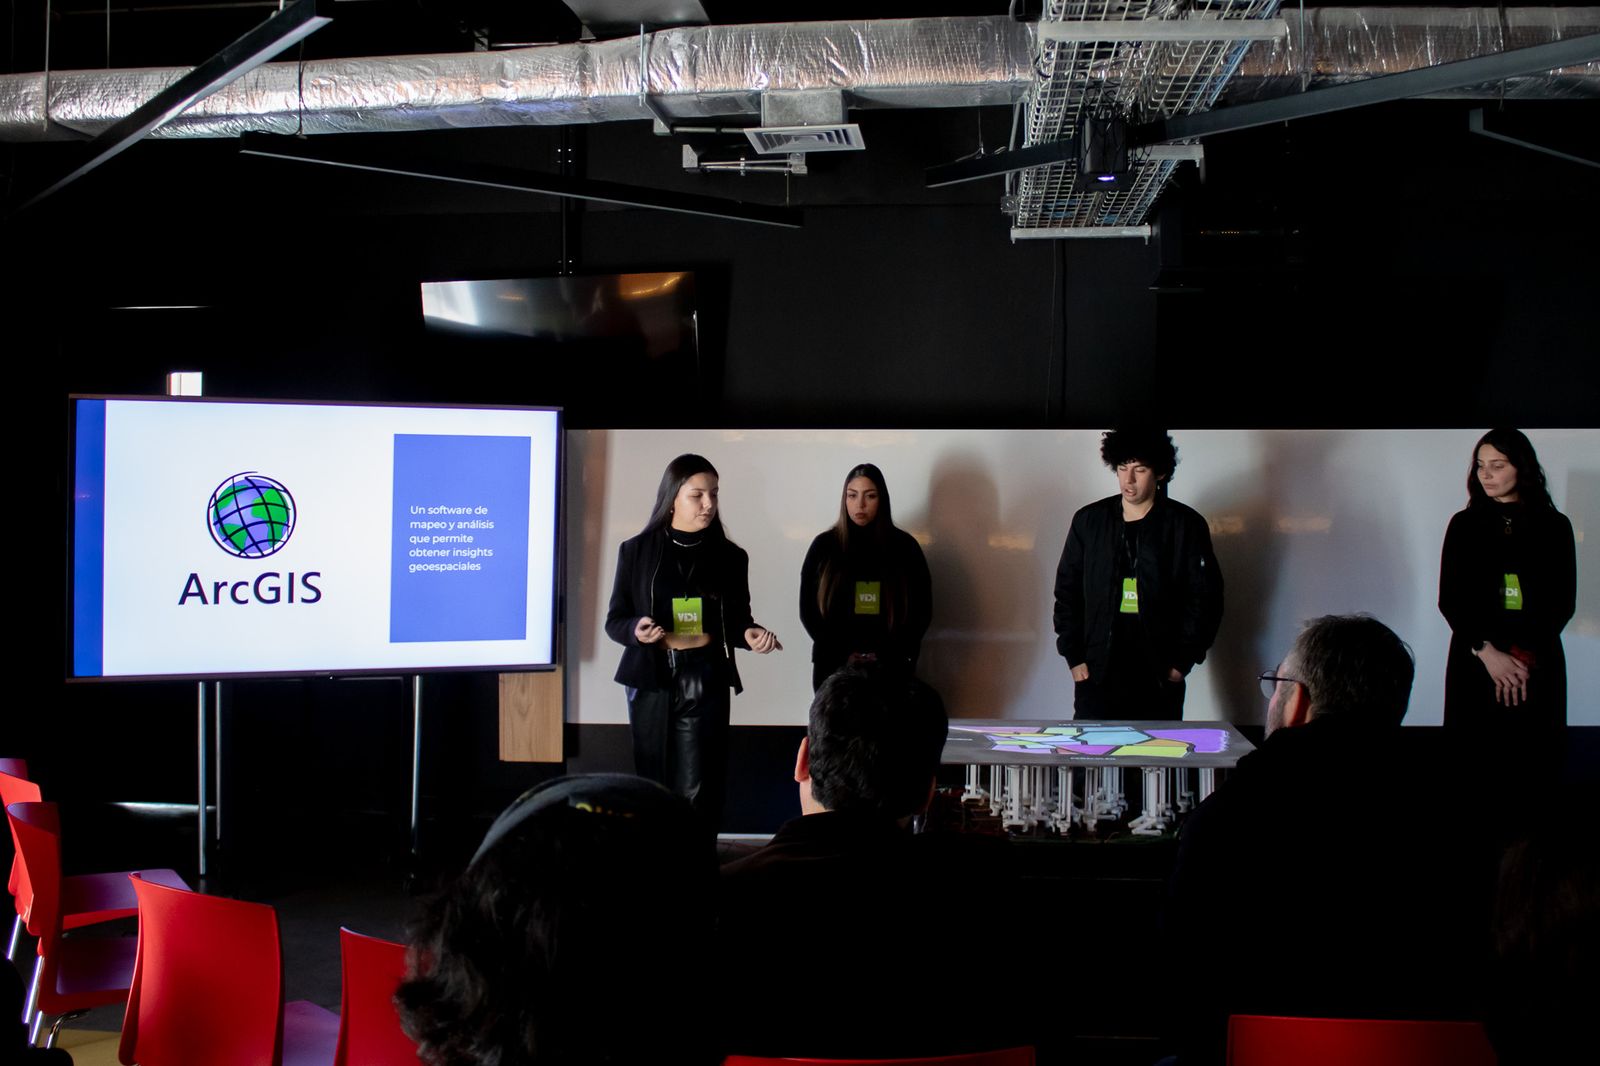
First presentation, 3 May: the opening and the value proposition (muted). 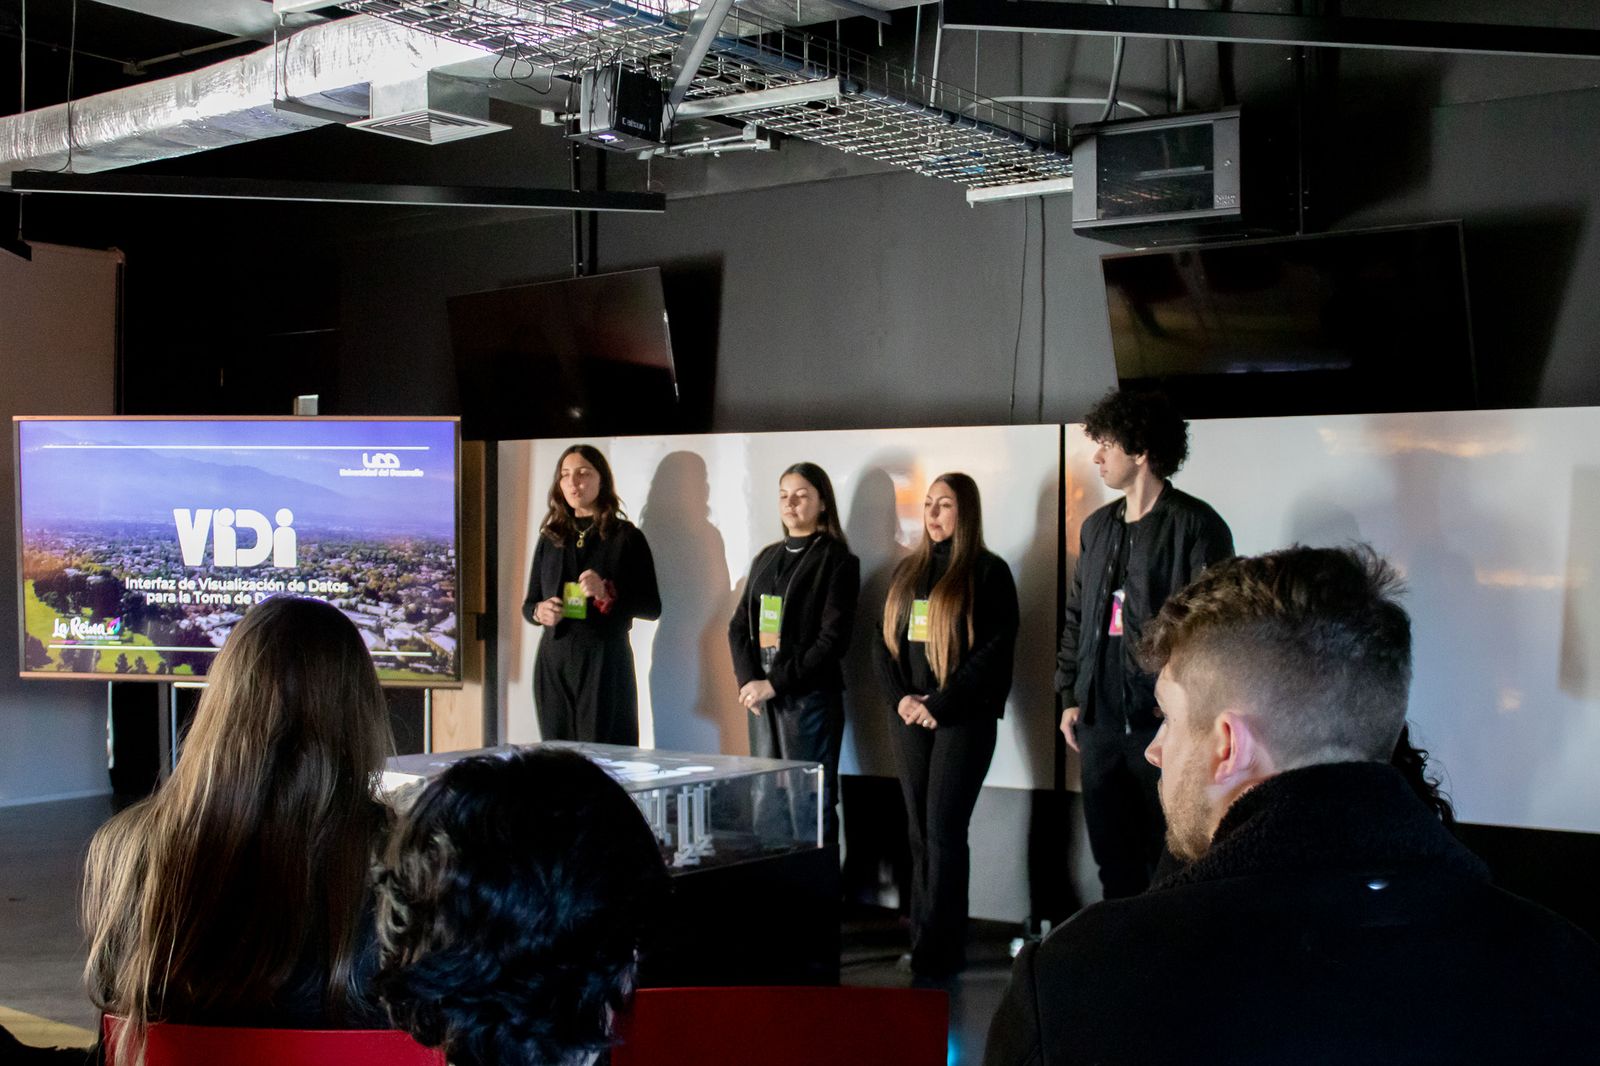
Final presentation, 12 July. 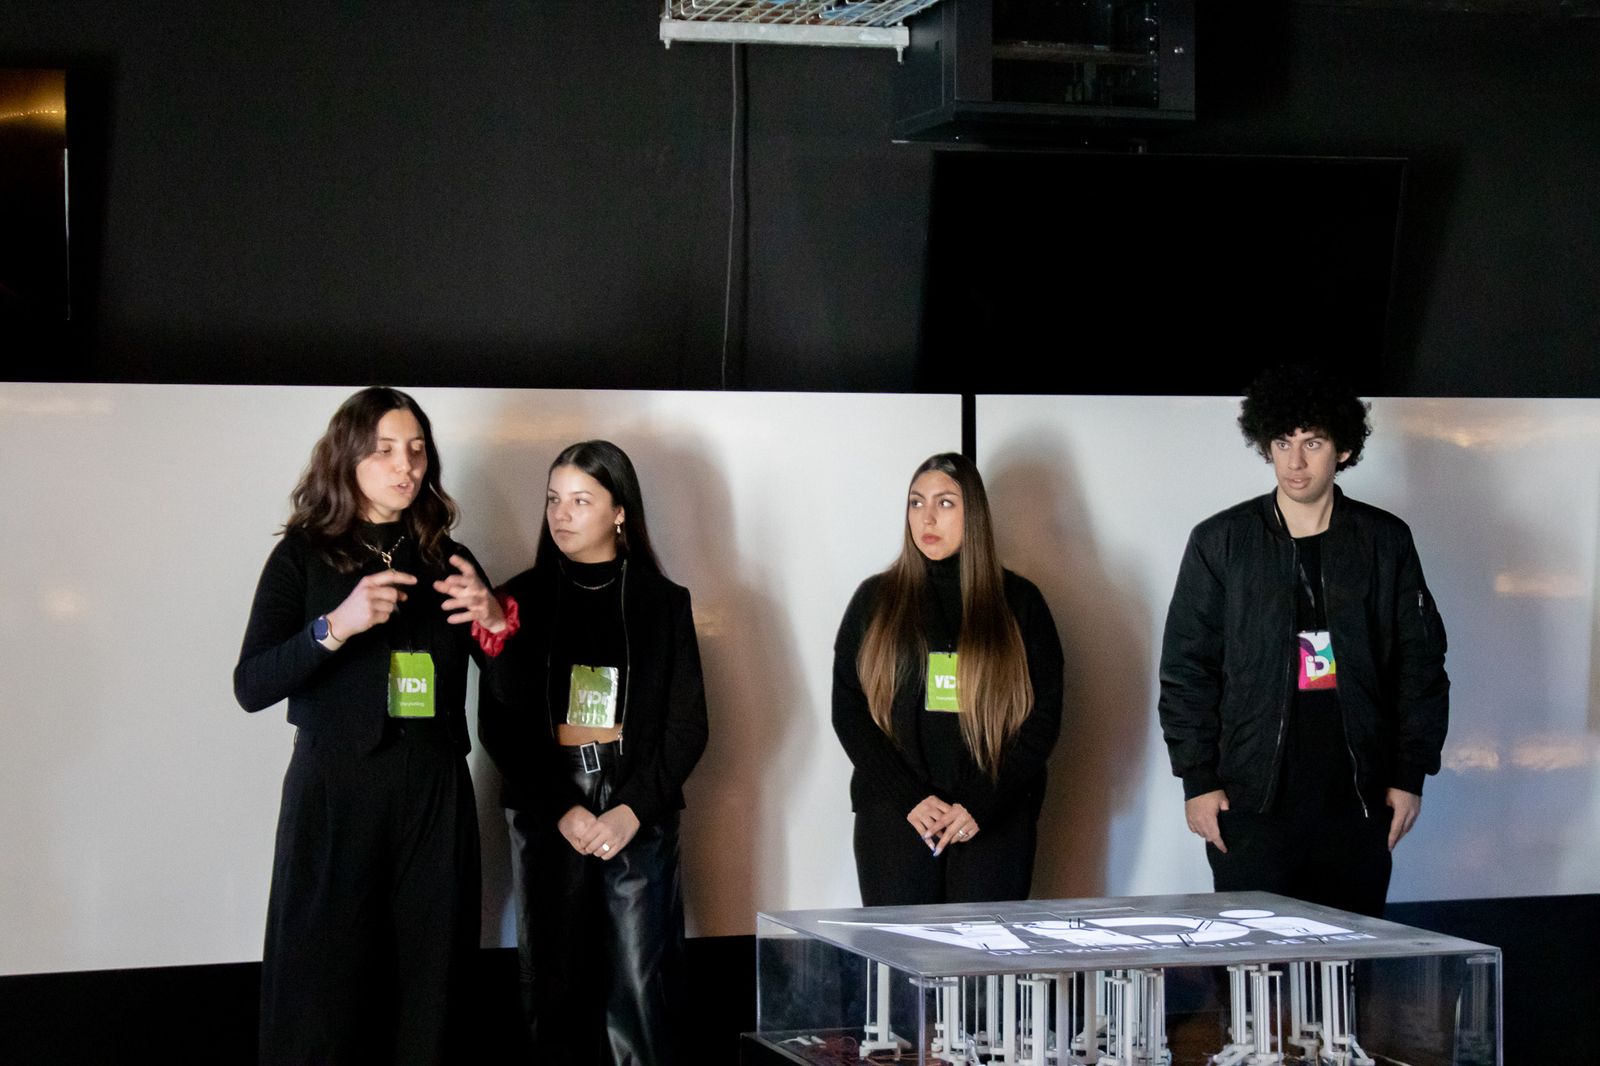
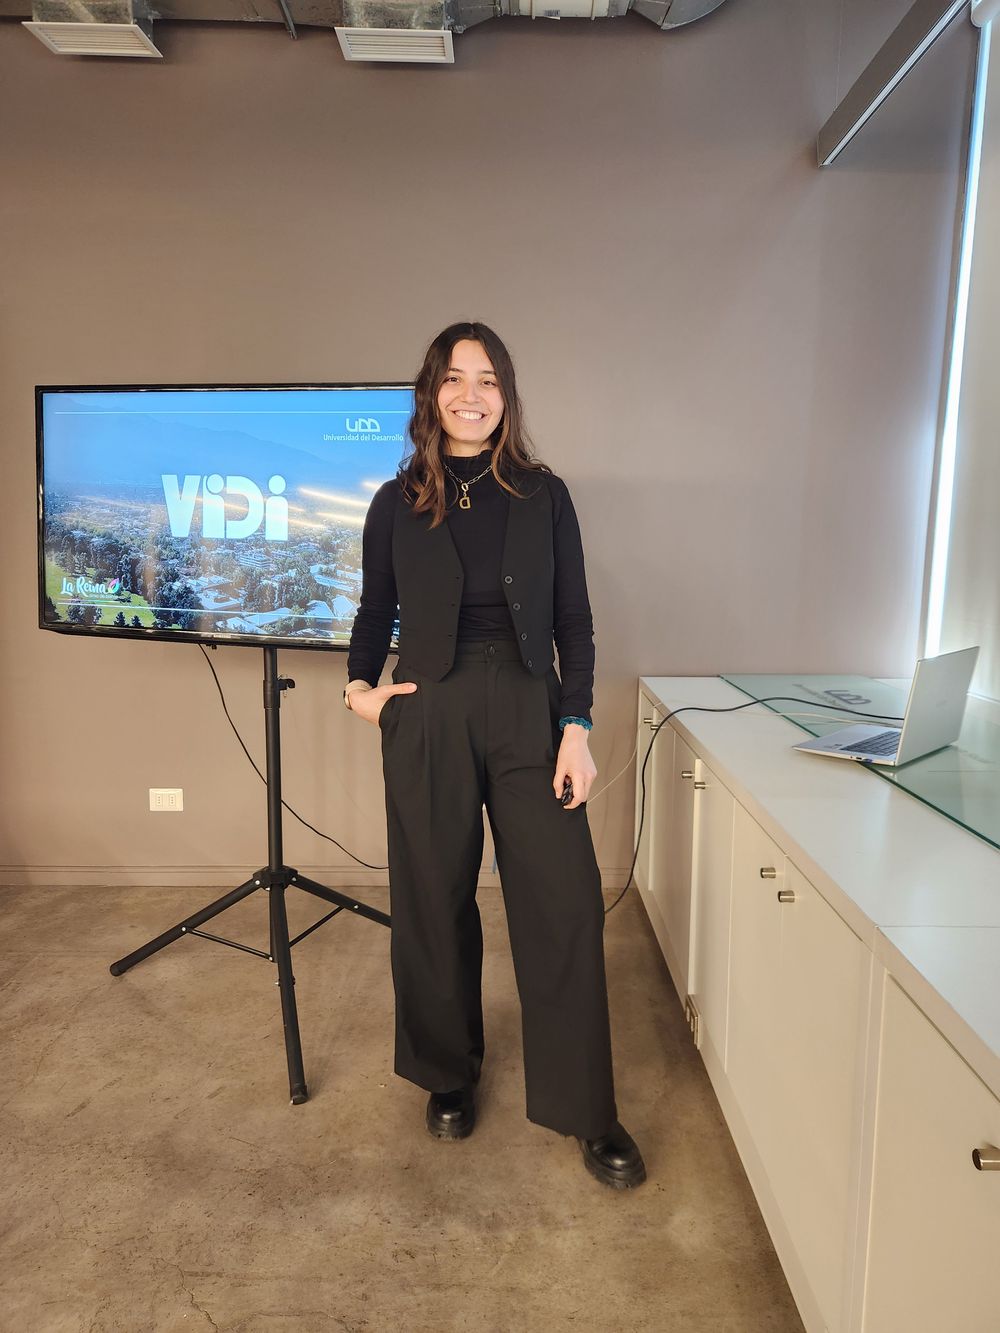
First presentation, 3 May. 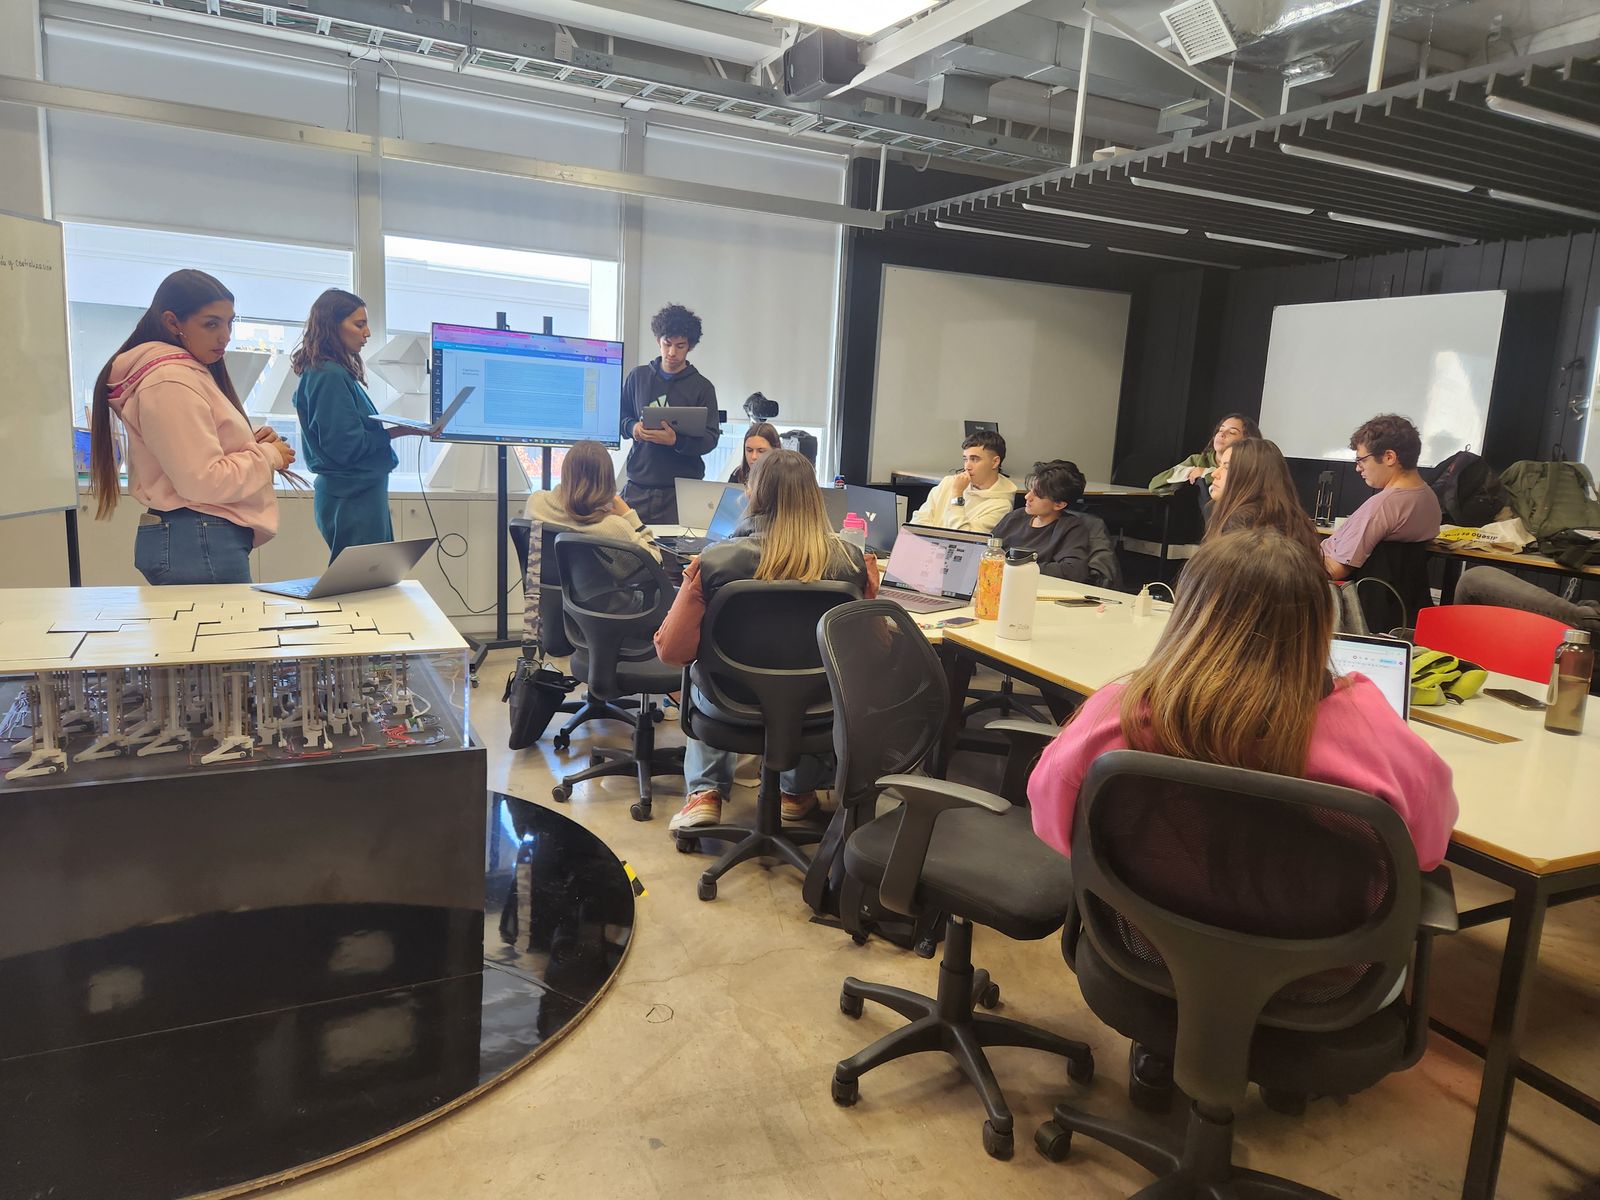
Presenting our progress in class, 26 April.
“Imagine a meeting where the data on citizen participation, security or the environment is presented clearly and concisely, so that everyone in the room understands the whole situation.”
Designing the room Mine
The presentation was also a design problem
A project for a real client is judged in the room where it is shown. As Storytelling, we designed the whole experience of the final presentation: where everyone sat, who entered when, and how the space told the story of VIDI.
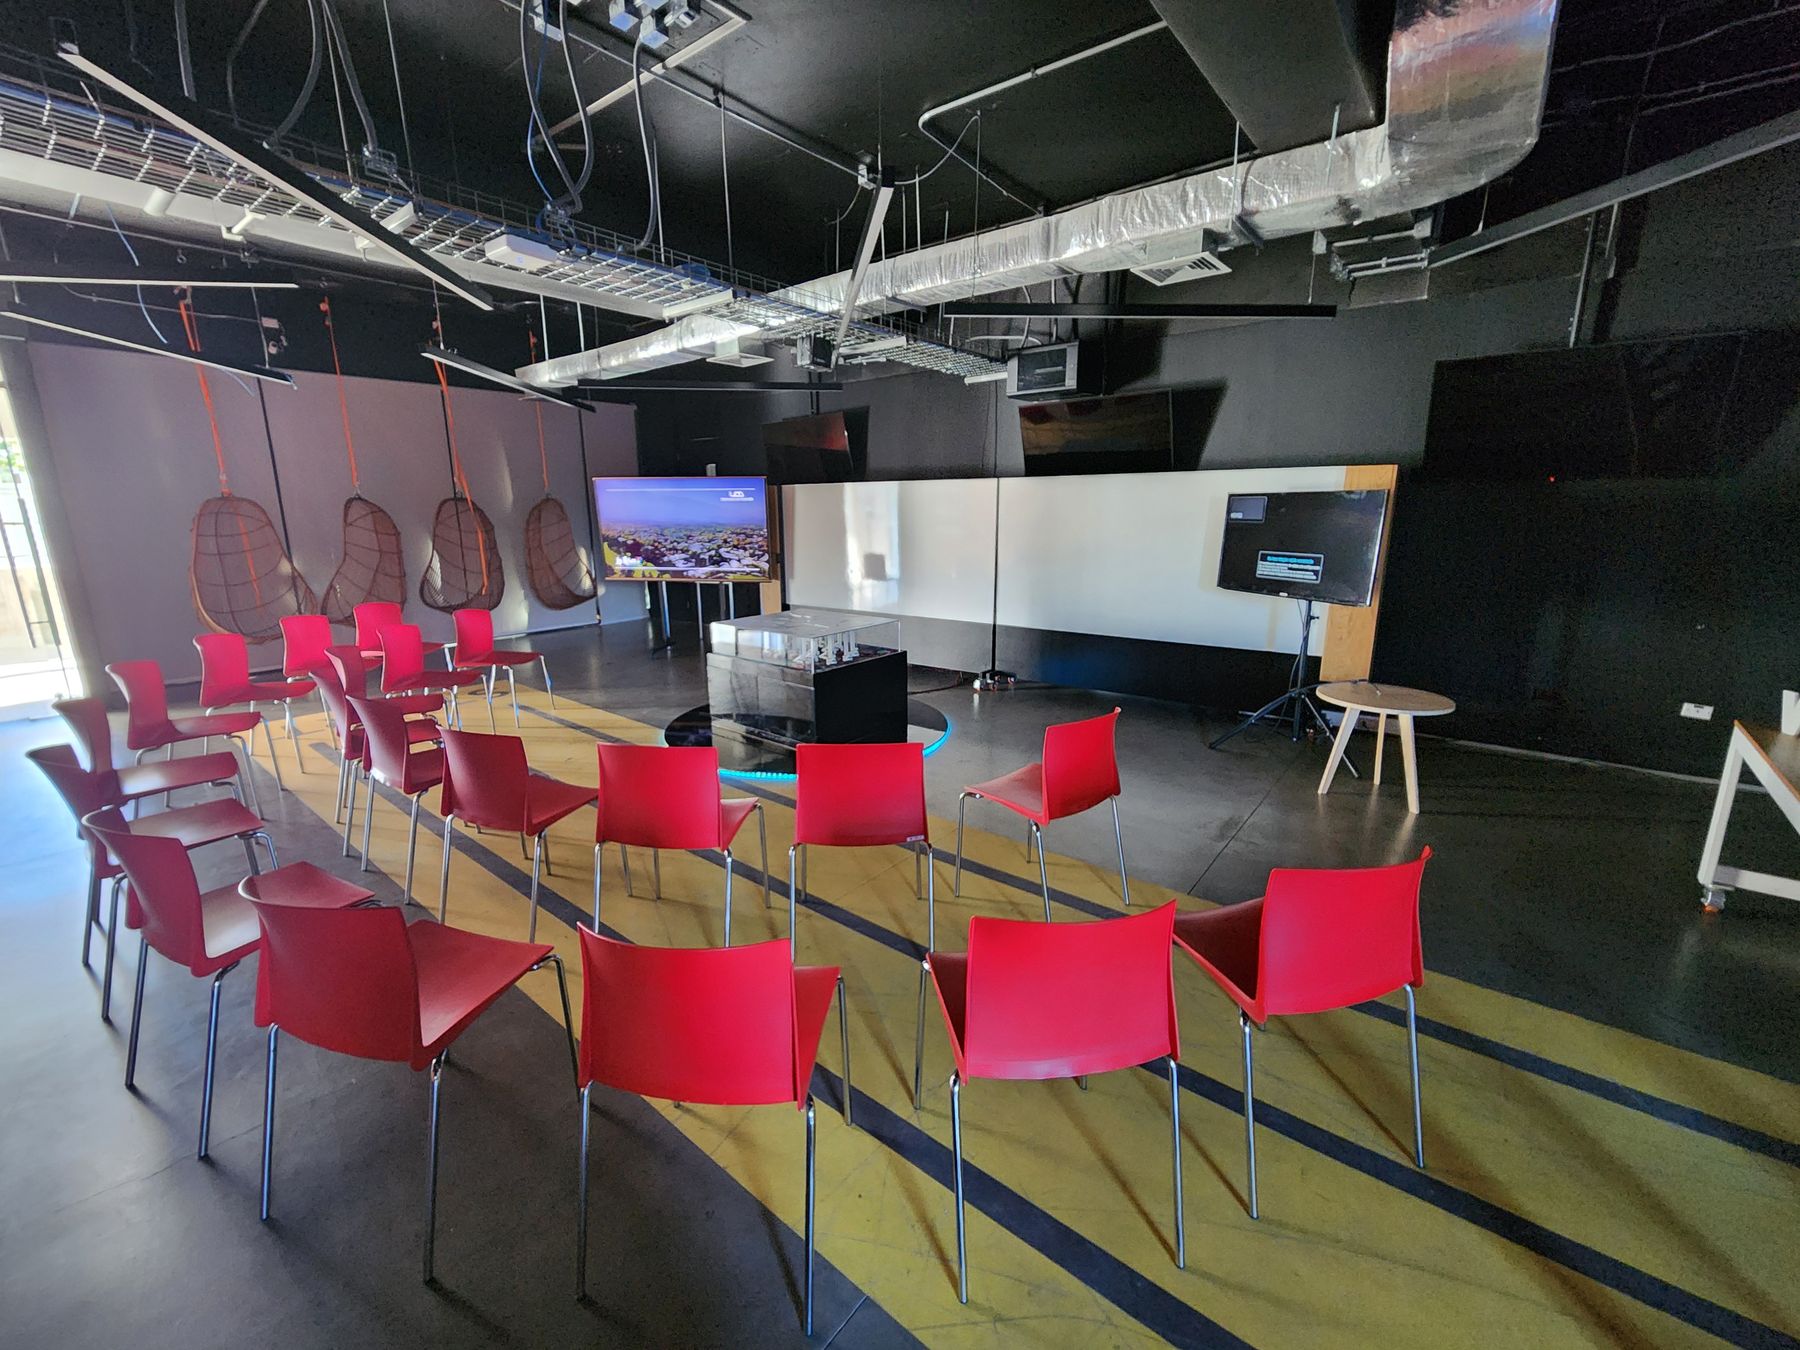
- Presentation screen, to the left of the table.
- The table, at the center: everything faces it.
- LED light under the base, for a sense of innovation, digitalization and a little futurism.
- Interface screen, to the right, showing the digital side of the system.
- Side table next to it, to hold the device running the interface.
- White surfaces behind, so there is nothing to distract from the presentation and the space stays tidy.
- A semicircle of seats, so the table and both screens are visible from every seat — and because it reflects how VIDI is used: collectively and connected.
- Information table against the wall, far right, with the manuals, the memoria and the material made by Records & Memoria.
Where everyone sat
The seats formed a semicircle around the table, so the table and both screens could be seen well from every chair. The front seats were for the dean, the rector, the municipal administrator, the cabinet advisor and the director of the program; the rest of the guests sat behind them.
How we moved
Storytelling began by explaining the whole project, entering from the left and leaving through the right. Then each brigade presented its own work, entering from left to right, and afterwards took the seats at the very back.
What was around the table
The presentation on the left screen, the interface on the right one, and a side table next to it for the device that ran the interface. Against the wall, at the far right, an information table held the manuals, the memoria and the material made by Records & Memoria.
The run of the afternoon
- 1
Lobbying
Before starting, a relaxed moment with coffee and snacks, so guests could talk with us.
- 2
Storytelling opens
We explained the whole project first, entering from the left and leaving to the right.
- 3
Each brigade
One by one, each brigade presented its work, entering from left to right and sitting in the back seats.
- 4
Open time
To finish, we invited everyone to come up to the table, look at each proposal and ask questions.
The result
A working prototype, and a hand-over
On 12 July 2024 we presented the final VIDI to the municipality and the university. It was a prototype: the software was an interactive design, and the table ran with the projections you see here.
Who we presented to
3 May 2024 · first presentation
- José Manuel Palacios — Mayor of La Reina
- Gustavo Opazo — Cabinet advisor
- Germán Espinoza — Director, Digital Interaction Design, Universidad del Desarrollo
- Alejandra Amenábar — Dean, Faculty of Design, Universidad del Desarrollo
- Ricardo Vidal and Osvaldo Zorzano — our guiding professors, together with other professors
12 July 2024 · final presentation
- Enrique Orrego Espinoza — Municipal administrator of La Reina
- Gustavo Opazo — Cabinet advisor
- Federico Valdés Lafontaine — Rector, Universidad del Desarrollo
- Alejandra Amenábar — Dean, Faculty of Design
- Germán Espinoza — Director, Digital Interaction Design
- Ricardo Vidal and Osvaldo Zorzano — our guiding professors, together with other professors
After the presentation
The municipality took VIDI with it to implement it.
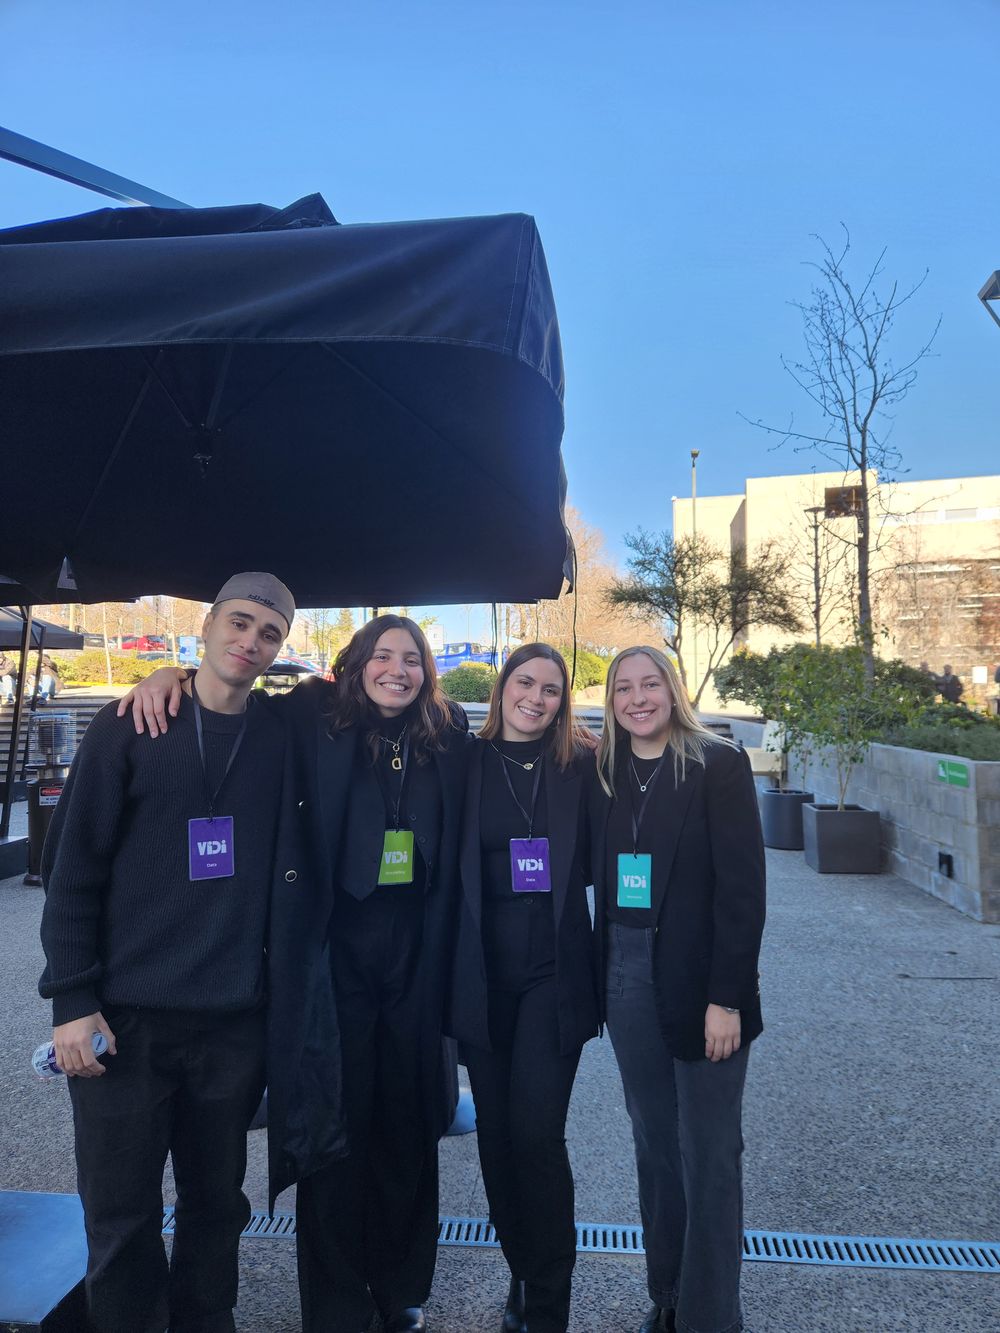
What stayed as a dream
Our memoria is honest about the limits. A professionally built app, a table made of a grid of small squares instead of fixed shapes, and voice control all needed more time, money and development than a semester allowed. VIDI also shows correlations, not causes: the people who read the data are the ones who decide.
The team
VIDI was made by the students of Interaction Workshop V, Digital Interaction Design, Universidad del Desarrollo, for the Municipality of La Reina, in the first semester of 2024.
- Benjamín Abud
- Raffaella Albasini
- Josefina Aravena
- Francisca Barraza
- Axel Berger
- Pedro Castañer
- Sophia Castillo
- Benjamín de la Cerda
- Belén Ferreira
- Josefina Friedli
- Isidora González
- Patricio Hernández
- Javiera Hernández
- Daniela Masihy
- Antonia Meza
- Sofía Muñoz
- Joaquín Rodríguez
- Magdalena Sabaté
- Pedro Selman
- Raffaella Tamborino
- María Antonia Ureta
Guiding professors: Ricardo Vidal and Osvaldo Zorzano.
FIM (Fisicalización Interactiva de Mapas) was developed in 2023 by a previous generation of students; we recognize their work as the base on which VIDI was built. With the Municipality of La Reina, the Universidad del Desarrollo and ExploraTec UDD.
Photos and videos are from the project’s own archive. The map, ArcGIS and municipal logos belong to their owners.